Recon Tool: Sniffer
Reading Time: 2 Minutes
Description
Sniffer by chenjiandongx, is a network troubleshooting tool that lets you analyze network traffic and processes without loading any kernel modules. With a user-friendly TUI interface, Sniffer captures and records packet information using gopacket. It supports BPF filters and combines the advantages of two projects while adhering to a new Plot mode.
sniffer manipulates gopacket to sniff the interfaces and record packets’ info. gopacket wraps the Golang port of libpacp library, and provides some additional features. One of the projects that inspired the sniffer is bandwhich, which has a sophisticated interface and multiple ways to display data, but it does not support BPF filters. Another one is nethlogs, which supports BPF filters, but can only view data by process, without connections or remote address perspective. sniffer combines the advantages of those two projects also adhering a new Plot mode.
Connections and Process Matching
On Linux, sniffer refers to the ways in which the ss tool used, obtaining the connections of the ESTABLISHED state by netlink socket. Since that approach is more efficient than reading the /proc/net/* files directly. But both need to aggregate and calculate the network traffic of the process by matching the inode information under /proc/${pid}/fd.
On macOS, the lsof command is invoked, which relies on capturing the command output for analyzing process connections information. And sniffer manipulates the API provided by gopsutil directly on Windows.
See Also: So you want to be a hacker?
Offensive Security Courses
Installation
sniffer relies on the libpcap library to capture user-level packets hence you need to have it installed first.
Linux / Windows
Debian/Ubuntu
$ sudo apt-get install libpcap-dev
CentOS/Fedora
$ sudo yum install libpcap libpcap-devel
Windows
Windows need to have npcap installed for capturing packets.
After that, install sniffer by go get command.
$ go get -u github.com/chenjiandongx/sniffer
MacOS
$ brew install sniffer
Trending: Offensive Security Tool: SecretOpt1c
Trending: Recon Tool: ScopeHunter
Usages
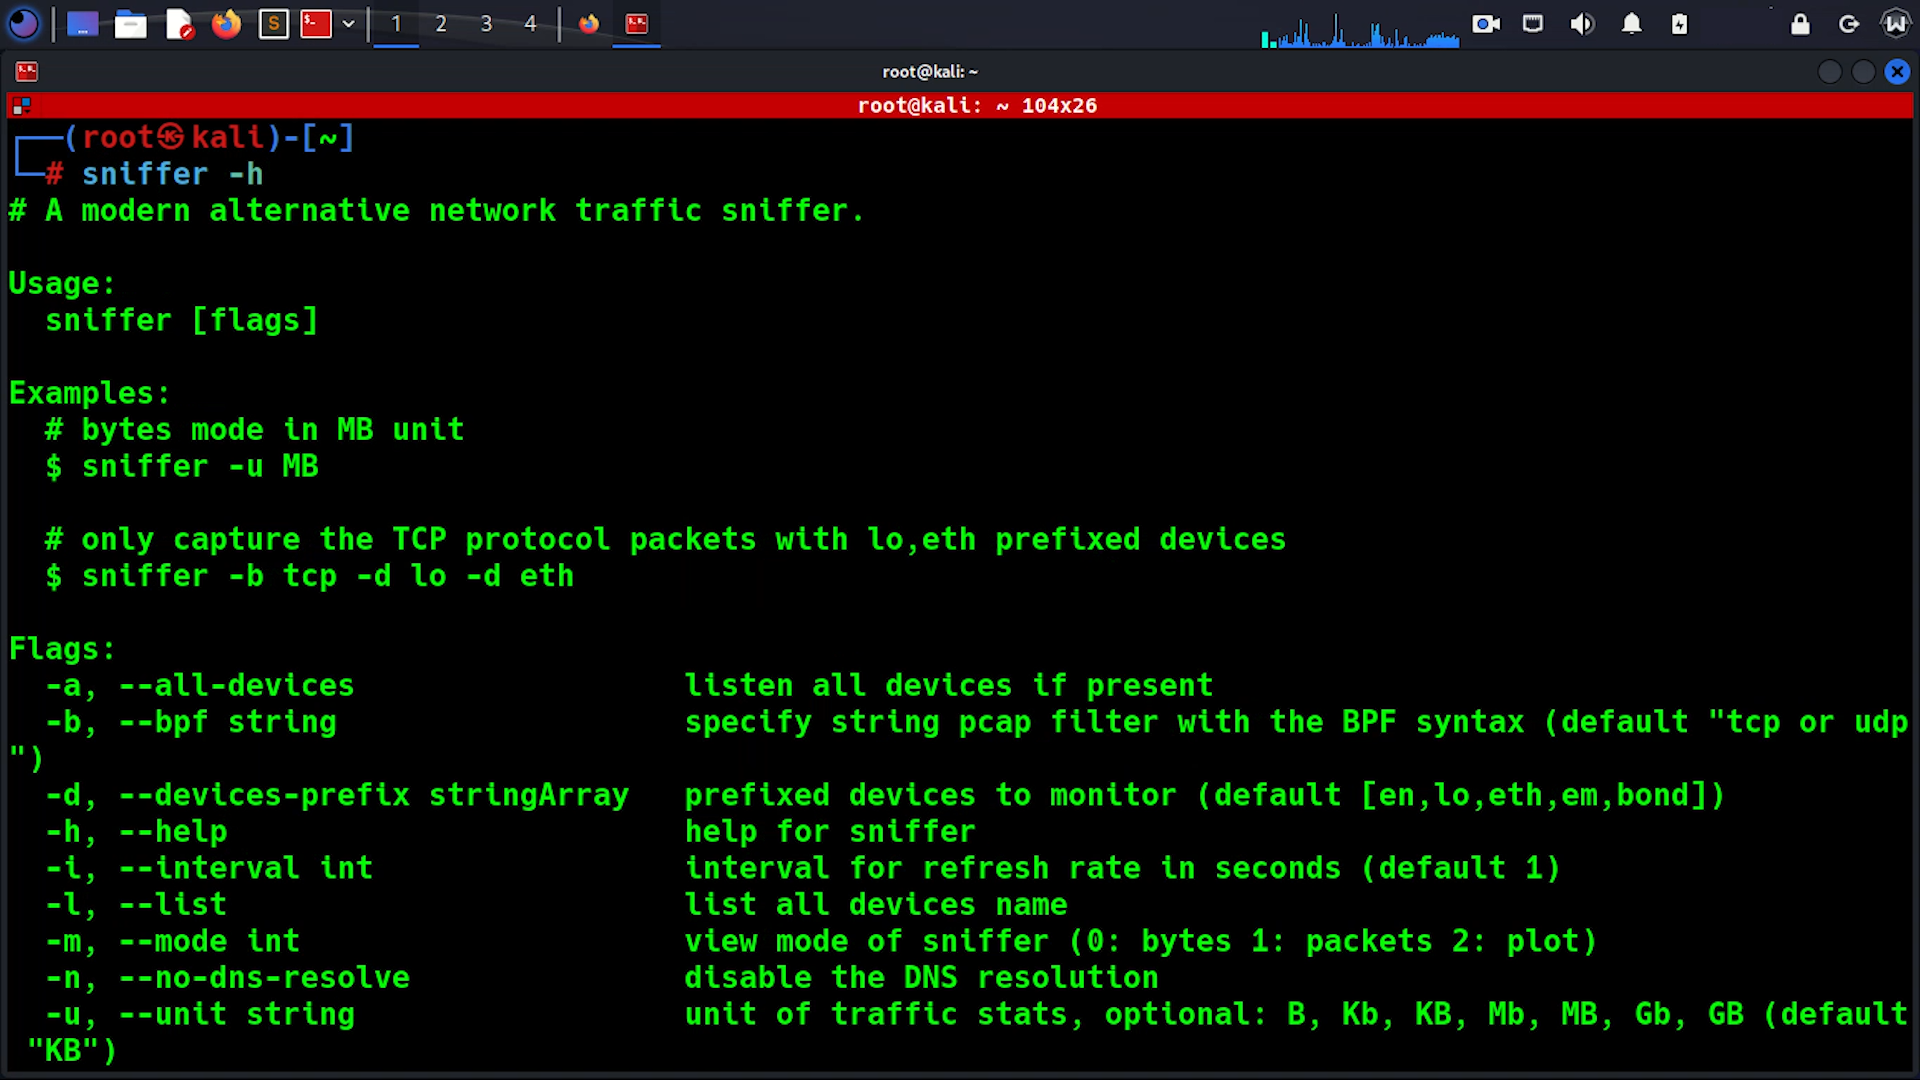
❯ sniffer -h
# A modern alternative network traffic sniffer.

Usage:
  sniffer [flags]

Examples:
  # bytes mode in MB unit
  $ sniffer -u MB

  # only capture the TCP protocol packets with lo,eth prefixed devices
  $ sniffer -b tcp -d lo -d eth

Flags:
  -a, --all-devices                  listen all devices if present
  -b, --bpf string                   specify string pcap filter with the BPF syntax (default "tcp or udp")
  -d, --devices-prefix stringArray   prefixed devices to monitor (default [en,lo,eth,em,bond])
  -h, --help                         help for sniffer
  -i, --interval int                 interval for refresh rate in seconds (default 1)
  -l, --list                         list all devices name
  -m, --mode int                     view mode of sniffer (0: bytes 1: packets 2: plot)
  -n, --no-dns-resolve               disable the DNS resolution
  -u, --unit string                  unit of traffic stats, optional: B, Kb, KB, Mb, MB, Gb, GB (default "KB")
  -v, --version                      version for sniffer
Hotkeys
| Keys | Description |
|---|---|
| Space | pause refreshing |
| Tab | rearrange tables |
| s | switch next view mode |
| q | quit |
Performance
iperf is a tool for active measurements of the maximum achievable bandwidth on IP networks. Next we use this tool to forge massive packets on the lo device.
$ iperf -s -p 5001
$ iperf -c localhost --parallel 40 -i 1 -t 2000
sniffer vs bandwhich vs nethogs
As you can see, CPU overheads bandwhich > sniffer > nethogs, memory overheads sniffer > nethogs > bandwhich.

See what stats they show, sniffer and bandwhich output are very approximate(~ 2.5GB/s). netlogs can only handles packets 1.122GB/s.
| sniffer | bandwhich | nethogs | |
| Upload | 2.5GiBps | 2.5GiBps | 1.12GiBps |
View Mode
Bytes Mode: display traffic stats in bytes by the Table widget.
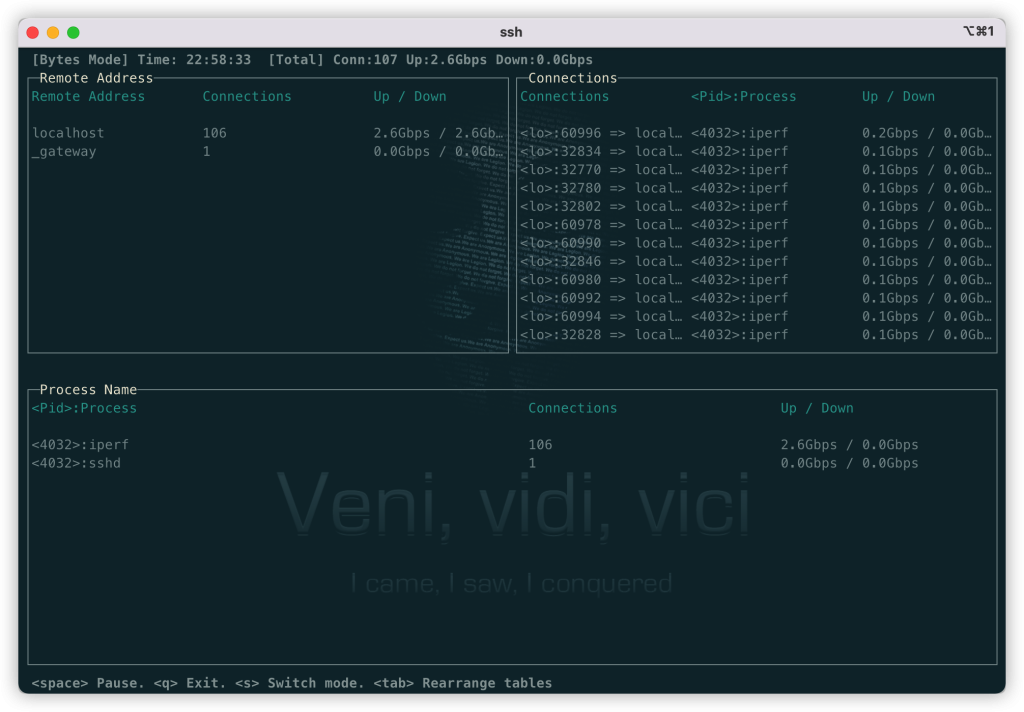
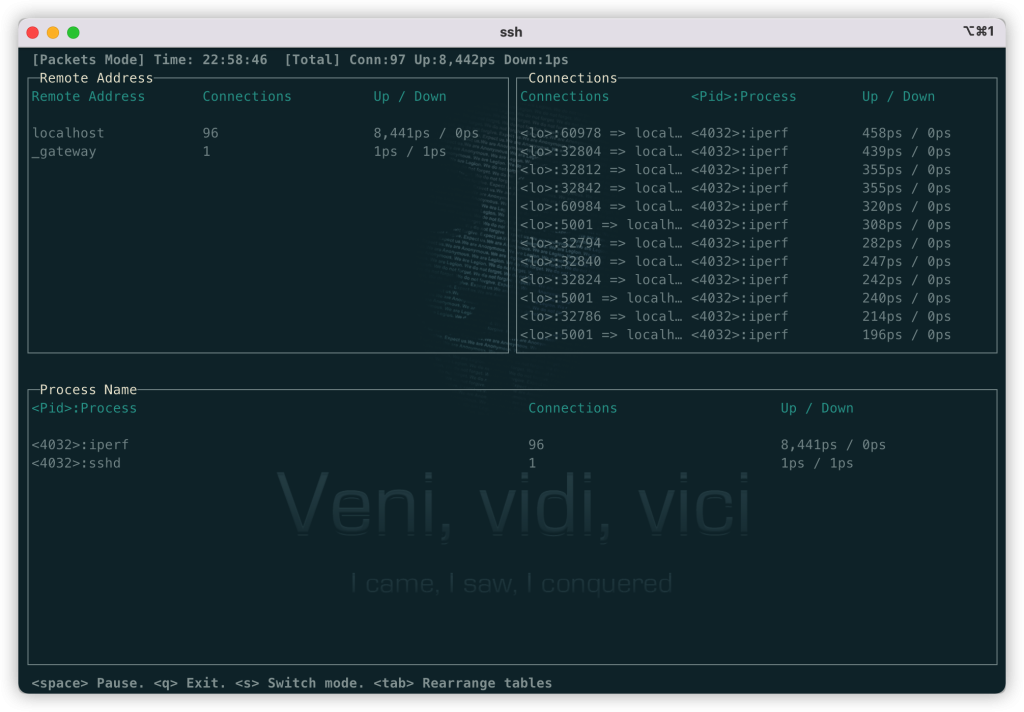
Packets Mode: display traffic stats in packets by the Table widget.
Clone the repo from here: GitHub Link
